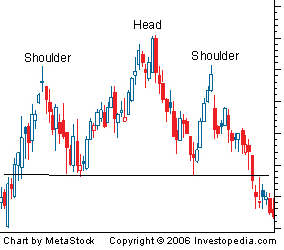
Head And Shoulders Pattern
- Head And Shoulders Pattern
- A technical analysis term used to describe a chart formation in which a stock's price:
1. Rises to a peak and subsequently declines.
2. Then, the price rises above the former peak and again declines.
3. And finally, rises again, but not to the second peak, and declines once more.
The first and third peaks are shoulders, and the second peak forms the head.

The "head-and-shoulders" pattern is believed to be one of the most reliable trend-reversal patterns.
Investment dictionary.
Academic.
2012.
Look at other dictionaries:
Head and shoulders (chart pattern) — The head and shoulders pattern is a commonly found pattern in the price charts of financially traded assets (stocks, bonds, futures, etc). The pattern derives its name from the fact that its structure is visually similar to that of a head with… … Wikipedia
Head and Shoulders — may refer to:*Head and Shoulders, a short story by F. Scott Fitzgerald first published in 1920 *Head Shoulders, a shampoo brand *Head and shoulders, a chart pattern employed in technical analysis, which is a method of stock market prediction … Wikipedia
head and shoulders — In technical analysis, a pattern that results where a stock price reaches a peak and declines; rises above its former peak and again declines; and rises a third time but not to the second peak, and then again declines. The first and third peaks… … Financial and business terms
Inverse Head And Shoulders — A chart pattern used in technical analysis to predict the reversal of a current downtrend. This pattern is identified when the price action of a security meets the following characteristics: 1. The price falls to a trough and then rises. 2. The… … Investment dictionary
Pattern — In technical analysis, the distinctive formation created by the movement of security prices on a chart. It is identified by a line connecting common price points (closing prices, highs, lows) over a period of time. Chartists try to identify… … Investment dictionary
head & shoulders — In technical analysis, a pattern that results where a stock price reaches a peak and declines; rises above its former peak and again declines; and rises a third time but not to the second peak, and then again declines. The first and third peaks… … Financial and business terms
art and architecture, Oceanic — ▪ visual arts Introduction the visual art (art) and architecture of native Oceania, including media such as sculpture, pottery, rock art, basketry, masks, painting, and personal decoration. In these cultures, art and architecture have often … Universalium
Chart pattern — A chart pattern is a pattern that is formed within a chart when prices are graphed. In stock and commodity markets trading, chart pattern studies play a large role during technical analysis. When data is plotted there is usually a pattern which… … Wikipedia
Captain Scarlet and the Mysterons — This article is about the 1967 TV series. For the 2005 series, see Gerry Anderson s New Captain Scarlet. Captain Scarlet and the Mysterons … Wikipedia
Morning star (candlestick pattern) — Illustration of the morningstar pattern The Morning Star is a pattern seen in a candlestick chart, a type of chart used by stock analysts to describe and predict price movements of a security, derivative, or currency over time. Description The… … Wikipedia

